The reparations proposal: $14 trillion.
In May 2023, Representative Cori Bush and cosponsors introduced a resolution calling for a minimum $14 trillion financial commitment to close the racial wealth gap, as part of reparations for slavery and subsequent discrimination.[7] “The United States has a moral and legal obligation to provide reparations for the enslavement of Africans and its lasting harm on the lives of millions of Black people,” she said.[28]

“America must provide reparations if we desire a prosperous future for all.”
Rep. Cori Bush · 17 May 2023[28]
77% of Black adults support reparations.
Pew Research Center · Survey: 4–17 October 2021 · Published 2022
Reparations? What about welfare?
A proposed reparations commitment happens to align with the total estimated welfare spending on Black Americans since 1979.
Minimum financial commitment proposed in H.Res.414.
2023 · Cori Bush & cosponsors[7]Cumulative gross allocation to Black Americans in the reconstruction.
1979–2026 · 2025 dollars · 2026 projectedWhite Americans pay 2.27 times as much federal income tax per person as Black Americans.Black Americans receive 2.0 times as much welfare per person as White Americans.
Estimated comparisons · FY2023 federal income-tax allocation · 2024 welfare allocation
Black Americans
Black alone and identifiable multiracial Black, including Hispanic Black people
Estimated federal income-tax receipts allocated to this group.
FY2023 · Treasury national total × Census model share · nominal dollars.
White Americans
Non-Hispanic White alone
Estimated federal income-tax receipts allocated to this group.
FY2023 · Treasury national total × Census model share · nominal dollars.
White / Black allocated federal income tax per resident.
$8,172 per White resident · $3,602 per Black resident.FY2023 allocation · nominal dollars · all residents, including children and nonworkers.
Inspect the model and Treasury allocation +
| Group | Population | Population share | Census model liability | Tax share | Allocated FY2023 receipts |
|---|---|---|---|---|---|
| Black Americans, including identifiable multiracial Black | 50.115m | 15.1% | $146.305bn | 8.3% | $180.519bn |
| Non-Hispanic White alone | 192.882m | 58.0% | $1277.410bn | 72.4% | $1576.140bn |
| All remaining groups | 89.385m | 26.9% | $340.252bn | 19.3% | $419.822bn |
| National total | 332.382m | 100.0% | $1763.967bn | 100.0% | $2176.481bn |
Pro-West Institute | |||||
Tax share: $146.305bn ÷ $1,763.967bn × 100 = 8.2941%, rounded to 8.3%. Population share: 50.115m ÷ 332.382m × 100 = 15.0775%, rounded to 15.1%.
White tax share: $1,277.410bn ÷ $1,763.967bn × 100 = 72.4169%, rounded to 72.4%. White population share: 192.882m ÷ 332.382m × 100 = 58.0302%, rounded to 58.0%.
Per-person comparison: Allocated White receipts / White population = $8,171.51 per resident. Allocated Black receipts / Black population = $3,602.10. Dividing the unrounded amounts gives 2.2685, rounded to 2.27×. Proportional scaling preserves the ratio. The population denominator includes children and nonworkers; this is not an average per taxpayer.
Method: sum FEDTAX_AC × (MARSUPWT ÷ 100) across person records. The selected Black race codes are 2, 6, 10, 11, 12, 16, 17, 18, 22 and 23, regardless of Hispanic origin. Unspecified multiracial codes are excluded. White uses PRDTRACE = 1 and PEHSPNON = 2. Joint income-tax liability follows the tax-unit head’s race; population includes all persons.[51][52][53]
Before refundable credits: $160.345bn, less $14.040bn of refundable credits, gives $146.305bn net. These original model liabilities determine the shares. Payroll, sales, property and other taxes are outside this income-tax figure.
Treasury allocation: the recorded national FY2023 individual income-tax total is $2,176.481bn. Multiply it by each unrounded model share: $180.519bn Black, $1,576.140bn non-Hispanic White, and $419.822bn for remaining groups. Equivalently, multiply original liabilities by 1.23385614. This is a proportional allocation of receipts, not government-observed receipts by race. The assumption carries calendar-year model shares into a fiscal-year receipts total with different refundable-credit accounting.[54]
Welfare share: The core-benefit dollar shares used to allocate the broader welfare total are 23.591986% for Black Americans and 45.111812% for non-Hispanic White Americans. These different-year figures are not subtracted to produce a net fiscal balance; refundable tax credits also require reconciliation before any such calculation.[1][2]
The tax and welfare comparison.
2023 reconstruction · Group totals · Billions of 2025 US dollars
Covered taxes fall short of estimated welfare benefits,even before accounting for Social Security retirement and insurance benefits; Medicare; the full VA budget; defense; and general federal spending.
Black Americans · 2023 comparison
2025 dollars
The comparison estimates $341.9bn in covered taxes against $470.4bn in welfare benefits for Black Americans.
The same comparison. Both groups.
| Measure | Black Americans | Non-Hispanic White Americans |
|---|---|---|
| Covered taxes | $341.9bn | $2,578.0bn |
| Estimated welfare allocation | $470.4bn | $967.9bn |
| Taxes minus welfare | −$128.5bn | +$1,610.1bn |
| Population used | 50.115m | 192.882m |
| Covered taxes per person | $6,822 | $13,366 |
| Welfare allocation per person | $9,386 | $5,018 |
| Balance per person | −$2,565 | +$8,348 |
Pro-West Institute | ||
The same defined tax and welfare coverage applies to both groups. Per-person figures use all group residents, including children and nonrecipients. See tax and spending scope
Sources & calculation +
Our survey-weighted tabulation of official U.S. Census Bureau microdata estimates these FICA and state income-tax totals for 2023. Census, within the U.S. Department of Commerce, supplies the modeled tax values; Pro-West Institute calculates the racial totals.[51][52][53][56]
Covered taxes = allocated federal income tax + modeled state income tax after credits + Census FICA. The 2023-dollar subtotals are $323.552bn for Black Americans and $2,439.980bn for non-Hispanic White Americans. Each is multiplied by 1.056583 to express it in 2025 dollars.[51][52][53][54]
Welfare uses the 2023 broad allocation model: $470.3906bn for Black Americans and $967.9bn for non-Hispanic White Americans. The White input comes from the dossier’s Table 8 and is rounded to one decimal billion.[1][2][55]
Taxes minus welfare = covered taxes − estimated welfare allocation. Divide each amount by its group’s full CPS population to obtain the per-person rows. Black includes identifiable multiracial and Hispanic Black people; White means non-Hispanic White alone. The federal allocation uses fiscal-year receipts and calendar-year modeled tax shares; the same timing assumption is used in both columns.
White Americans contribute 2.27 times as much federal income tax per person in the 2023 allocation. Black Americans receive 2.0 times as much welfare per person in the 2024 model.
Group totals tell one story. Per-person figures tell another. Divide each group’s 2023 tax-and-welfare balance by its full population to compare the result per resident.
Net personal income contribution
2023 · Estimate of State & Federal Income taxes plus Payroll taxes minus Welfare · 2025 US dollars
Black Americans
−$2,565DEFICIT / PERSON / YEAR−$128.5bn group total
Non-Hispanic White Americans
+$8,348SURPLUS / PERSON / YEAR+$1,610.1bn group total
Difference in annual contribution per personNon-Hispanic White balance minus Black balance
Positive means covered taxes exceed estimated welfare benefits. Negative means estimated welfare benefits exceed covered taxes. The same coverage and population definitions apply to both groups.
How common is benefit receipt?
For Black Americans, 57.6% received at least one of the five measured benefits during 2024. For non-Hispanic White Americans, the figure was 29.8%. That is a difference of almost 28 percentage points.
Receipt of assistance: the gap within each group.
2024 · Received at least one measured benefit
About 58 in every 100 people
About 30 in every 100 people
Higher measured receipt among Black Americans.
The participation rate is 1.93 times the White rate.
Welfare and public healthcare.
Africa in context.
54 African countries · South Africa and Botswana included
Broad African (54-country) welfare allocation
Annual benchmark at a 2022 baseline.
Current US dollars.
Broad US welfare allocation
2024 allocation model.
2025 US dollars.
combined annual African benchmark
Across 1.444 billion residents
What is counted, and how +
Africa: $46.721bn social assistance + $54.016bn domestic public healthcare = $100.737bn. Dividing by 1,444,092,389 residents gives about $69.76 per resident. Rounded component values can differ by one cent from the rounded total.
The welfare model applies selected national spending shares to 2022 GDP: 51 national benchmarks and three proxies. Many source observations predate 2022. Healthcare uses WHO’s 2022 domestic government revenue category (FS.1), excluding contributory social insurance, private payments and capital spending.[41][42]
Adding $6.267bn in recorded government-channelled foreign health funding raises the combined benchmark to $74.10 per resident. That optional addition covers 52 countries. South Africa and Botswana together account for $36.6bn of the domestic benchmark.
Inspect all 54 countries +
| Country | Social assistance | Domestic healthcare | Combined base | Foreign health | Base / resident |
|---|---|---|---|---|---|
| Algeria | 8,120.9 | 3,084.6 | 11,205.6 | 19.6 | $246.4 |
| Angola | 512.9 | 1,861.9 | 2,374.8 | 35.5 | $66.6 |
| Benin | 212.6 | 80.6 | 293.2 | 76.8 | $21.3 |
| Botswana | 337.3 | 875.3 | 1,212.7 | 24.3 | $497.0 |
| Burkina Faso | 414.5 | 512.9 | 927.4 | 208.6 | $41.2 |
| Burundi | 83.2 | 49.4 | 132.6 | 54.1 | $10.0 |
| Cabo Verde | 42.2 | 72.5 | 114.8 | 12.9 | $220.9 |
| Cameroon | 17.7 | 295.1 | 312.9 | 171.4 | $11.3 |
| Central African Republic | 24.4 | 36.7 | 61.1 | 23.3 | $12.0 |
| Chad | 110.5 | 162.3 | 272.8 | 99.9 | $14.8 |
| Comoros | 8.6 | 10.3 | 18.9 | 40.9 | $22.6 |
| Congo, Dem. Rep. | 297.8 | 449.9 | 747.8 | 570.5 | $7.3 |
| Congo, Rep. | 7.9 | 112.2 | 120.1 | 6.4 | $19.9 |
| Cote d’Ivoire | 115.9 | 932.8 | 1,048.6 | 120.5 | $34.5 |
| Djibouti | 21.4 | 28.6 | 50.0 | 11.2 | $44.0 |
| Egypt | 10,488.4 | 5,960.8 | 16,449.3 | 530.8 | $146.1 |
| Equatorial Guinea* | 91.7 | 100.0 | 191.7 | — | $106.3 |
| Eritrea* | 25.2 | 21.5 | 46.6 | 11.6 | $13.7 |
| Eswatini | 70.7 | 155.4 | 226.1 | 20.5 | $185.5 |
| Ethiopia | 601.4 | 857.5 | 1,458.8 | 392.2 | $11.6 |
| Gabon | 38.2 | 297.5 | 335.7 | 16.2 | $138.1 |
| Gambia, The* | 14.8 | 34.0 | 48.8 | — | $18.5 |
| Ghana | 93.0 | 1,453.7 | 1,546.7 | 81.4 | $46.7 |
| Guinea | 296.7 | 139.7 | 436.4 | 64.2 | $31.0 |
| Guinea-Bissau | 13.2 | 17.8 | 31.1 | 16.1 | $14.8 |
| Kenya | 400.6 | 2,226.2 | 2,626.8 | 384.3 | $48.4 |
| Lesotho | 167.0 | 154.8 | 321.8 | 43.6 | $140.8 |
| Liberia | 3.4 | 51.3 | 54.6 | 41.1 | $10.2 |
| Libya | 864.9 | 1,361.6 | 2,226.5 | 10.9 | $308.2 |
| Madagascar | 24.5 | 136.0 | 160.6 | 45.9 | $5.3 |
| Malawi | 186.4 | 109.0 | 295.4 | 242.9 | $14.4 |
| Mali | 135.2 | 164.6 | 299.9 | 24.0 | $13.0 |
| Mauritania | 232.4 | 80.7 | 313.1 | 60.9 | $64.2 |
| Mauritius | 447.6 | 325.8 | 773.4 | 31.6 | $612.6 |
| Morocco | 3,149.9 | 1,963.6 | 5,113.5 | 10.7 | $137.0 |
| Mozambique | 239.8 | 432.2 | 672.0 | 340.9 | $20.6 |
| Namibia | 401.0 | 729.8 | 1,130.8 | 55.5 | $391.3 |
| Niger | 104.1 | 230.8 | 334.8 | 121.7 | $13.2 |
| Nigeria | 798.0 | 2,630.3 | 3,428.3 | 360.2 | $15.4 |
| Rwanda | 206.2 | 280.1 | 486.3 | 203.7 | $35.6 |
| Sao Tome and Principe | 0.0 | 12.3 | 12.3 | 9.1 | $54.2 |
| Senegal | 247.3 | 225.5 | 472.8 | 138.7 | $26.8 |
| Seychelles | 94.1 | 60.5 | 154.6 | 0.0 | $1,289.8 |
| Sierra Leone | 64.1 | 61.9 | 126.0 | 0.0 | $15.2 |
| Somalia, Fed. Rep. | 18.4 | 31.8 | 50.2 | 7.9 | $2.8 |
| South Africa | 13,491.4 | 21,905.0 | 35,396.4 | 0.0 | $567.4 |
| South Sudan | 550.4 | 50.4 | 600.8 | 0.0 | $54.5 |
| Sudan | 346.2 | 276.8 | 623.0 | 224.9 | $12.6 |
| Tanzania | 348.4 | 492.9 | 841.4 | 432.7 | $13.0 |
| Togo | 101.9 | 33.9 | 135.8 | 34.2 | $16.8 |
| Tunisia | 1,437.8 | 954.0 | 2,391.8 | 163.4 | $197.4 |
| Uganda | 350.9 | 465.0 | 815.9 | 322.9 | $17.2 |
| Zambia | 72.9 | 634.0 | 706.9 | 249.5 | $35.1 |
| Zimbabwe | 175.3 | 332.1 | 507.4 | 96.6 | $31.6 |
Pro-West Institute | |||||
*Eritrea, The Gambia and Equatorial Guinea use welfare proxies. A dash indicates a missing foreign-health observation, not zero. The foreign-health column is separate from the combined domestic base.[41][43][44][45][46][47][48]
The historical welfare reconstruction reaches approximately $13.50 trillion from 1979 through 2026, in 2025 dollars. That total includes a projected final year. It describes estimated programme allocations across decades—not a published government ledger recording racial payments.
Forty-eight years, in one price year.
Cumulative estimated allocation · Trillions of 2025 dollars
Estimated deficit between covered tax payments and welfare benefits.2023 comparison · 2025 dollars.
Major public spending not fully allocated to the deficit
Social Security retirement and insurance benefits; Medicare; the full VA budget; defense; and general federal spending would all increase the stated deficit.
Other taxes outside the calculation
Sales, property and other tax contributions.
Medicaid/CHIP and SSI are already in the benefit measure. Some means-tested veterans’ assistance is included in the source inventory; the full VA budget is not allocated. Refundable-credit overlap remains unreconciled.[1][2][3][4]
Are White Americans born owing money to Black Americans because of the color of their skin?
By 2026, 161 years have passed since the Civil War ended and the 13th Amendment was ratified.[8][10]
In 1860, at least 98.52% of White residents were not recorded as slave owners. The recorded-holder count amounted to at most 1.48% of the White population, including residents of all ages. Separately, the 1830 records identify 3,776 free Black slaveholders, almost 4,000.[20][24][25]
Yet the Union Army recorded nearly 2.5 million White enlistments during 1861–1865 in a war that claimed approximately 360,000 Union lives. Hundreds of thousands of White Union men died in a war whose victory made abolition possible.[8][16]
Even by the logic of blood-guilt, the sacrifice of non-slave-owning White Americans fighting for the Union 160 years ago would have satisfied their claim. But as Americans, we do not believe in inheriting the sins of the father. Proposing a monetary burden on White Americans because of the color of their skin is definitionally a racist policy.
Inspect the military and census records +
Service and sacrifice: White soldiers gave their lives for Black freedom.
| Group | Enlistment strength | Approximate deaths |
|---|---|---|
| White soldiers | 2,489,836[16] | ≈320,000* |
| Black soldiers | 178,975[16] | ≈40,000[9] |
Pro-West Institute | ||
≈360,000 total Union dead. The enlistment figures count enlistments rather than a deduplicated list of individuals. About 19,000 Black men also served in the Navy.[8][9]
*How the White death estimate is obtained
360,000 total Union Army deaths minus nearly 40,000 Black Army deaths leaves roughly 320,000 deaths among other troops, overwhelmingly White. This is a rounded estimate of White deaths, not a separately reported exact racial count; the residual includes deaths among smaller groups. NPS also records 3,530 Native American Army enlistments.
Free Black Americans owned Black slaves too.
| Measure | Census year | Result |
|---|---|---|
| Upper bound on individual White slaveholding | 1860 | ≤1.48%[20] |
| Recorded free Black slaveholders | 1830 | 3,776[25] |
| Enslaved people held by those Black owners | 1830 | 12,907[25] |
Pro-West Institute | ||
The White upper bound uses all recorded 1860 slaveholders divided by White residents of every age. The 1830 Black-owner figures follow Pressly’s analysis of Woodson’s records. Those records include both commercial slaveholding and ownership of relatives purchased by family members.[24][25]
African suppliers and European traffickers.
African rulers, armies and merchants captured and sold people from other African communities through warfare, raids and trade. European traders purchased many captives at coastal markets and organized their transport across the Atlantic. Early Portuguese expeditions also captured people directly in coastal raids.[26][27]
Abolition was a process. These dates matter.
Britain, the United States and the distance from 1865 to 2026
Britain bans its slave trade
British participation is prohibited. Royal Navy suppression follows over decades.
US import ban takes effect
The American law takes effect on 1 January. Illicit imports and domestic trading continue.
Slavery abolished in the US
Union victory and the 13th Amendment end legal chattel slavery. Ratified 6 December.
161 years later
6.5 generations since 1865.
Approximate generational distance, using 25 years per generation.
Britain’s suppression of the Atlantic trade was substantial: over decades, the Royal Navy seized more than 1,600 ships and freed about 150,000 Africans. [13]
Is America somehow racist?
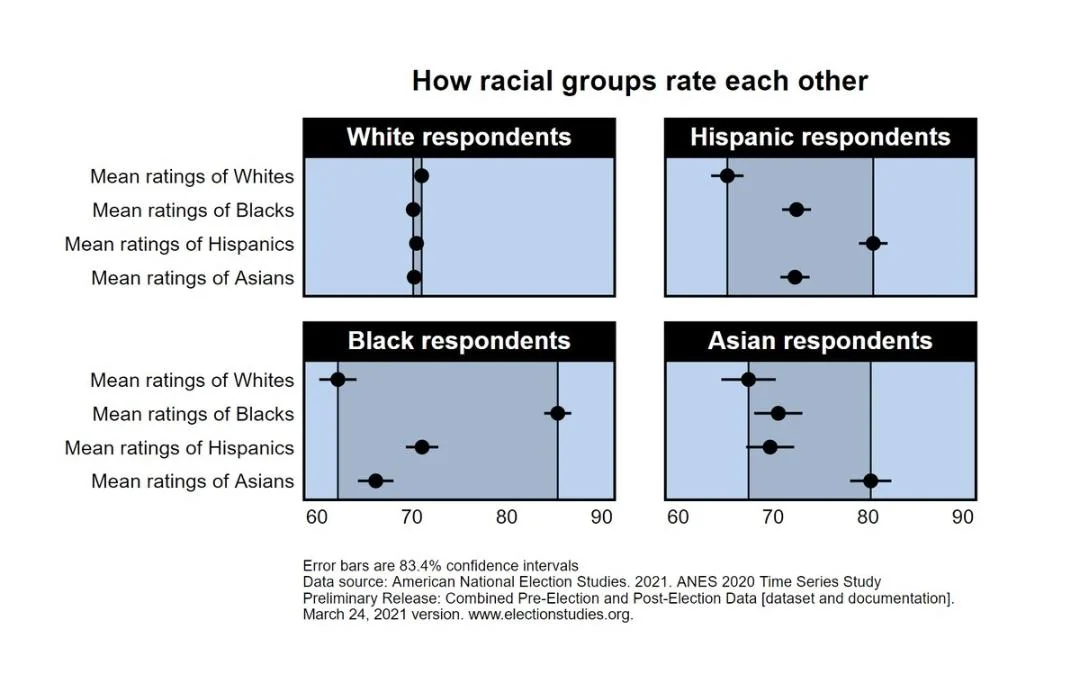
White respondents gave the most uniform average ratings of other racial groups among the four respondent groups compared in this survey. Black, Asian and Hispanic respondents each gave Whites their lowest average rating. This pattern of lower expressed warmth toward Whites challenges a one-sided account of racial prejudice.[30][31]
How Americans rate racial groups.
ANES 2020 · Weighted mean warmth · 0–100 response scale
White respondents’ average ratings across all four groups.
White respondents
Black respondents
Hispanic respondents
Asian respondents
View the supplied graphic +
Public support belongs in the argument. Our welfare model estimates nearly twice the per-person allocation to Black Americans as to non-Hispanic White Americans. Beyond US borders, USAID alone disbursed a reported $131.6 billion to African countries during 2001–2024. The African Energy Chamber puts broader international aid to Africa since 1960 above $2.6 trillion.[32][33][34] Private giving is additional to the USAID figure: OECD records $17.6 billion in cross-border philanthropy to Africa during 2020–2023 alone.[35]
If White America is racist, why have there been decades of generous aid for Africa?
Federal assistance continued for decades. Private philanthropy provided billions more.
2001–2024 · Africa Data Hub analysis of US foreign-assistance records.[32]
Since 1960 · African Energy Chamber estimate, published in 2025 and cited by CFR.[33][34]
Broader donor total. Not US spending alone.The case against another $14 trillion.
2025 purchasing power · CPI update of the CRS estimate[21][22]
Upper bound on the share of White residents recorded as slaveholders[20]
Racial identity should not create inherited financial guilt. Today’s White Americans are not interchangeable with nineteenth-century slaveholders. In 1860, the last national census before abolition, 393,975 recorded slaveholders compared with 26,690,781 White residents yields an upper bound of 1.48% for individual White ownership. This compares named holders with residents of all ages, not households or descendants.[20]
Millions of European immigrants arrived after abolition. Ellis Island alone processed approximately 12 million immigrants between 1892 and 1954, many from Europe. Present-day racial identity does not establish whether a particular family owned slaves.[23]
Abolition also came at an immense human and financial price. Union military operations cost $3.183 billion in period dollars—approximately $85 billion in 2025 purchasing power, before later veterans’ benefits and debt interest.[21][22] Hundreds of thousands of White Union servicemen died in the war whose victory ended slavery. The rounded estimate of about 320,000 White Union Army deaths is of a similar order to the approximately 388,000 Africans brought directly to the United States across the Atlantic trade. These are different historical periods: the import figure spans the trade, while the military deaths occurred in 1861–1865.[8][9][16][19]
The financial account already includes support on a comparable scale. This reconstruction estimates $13.50 trillion in welfare allocations to Black Americans from 1979 through 2026, in 2025 dollars, with 2026 projected.
A new $14 trillion commitment is not justified. Slavery ended 161 years ago—approximately 6.5 generations. The Union victory that secured abolition was paid for in blood, including the lives of hundreds of thousands of White soldiers. Today’s White Americans should not inherit a collective financial liability because they share a race with people who lived in the nineteenth century. The sacrifice that secured freedom and the public support provided since belong in the assessment of this demand.
A $14 trillion reparations demand must confront the redistribution already taking place.
Our 2023 reconstruction estimates that Black Americans contributed $341.9 billion in covered federal and state income taxes and payroll taxes, against $470.4 billion in allocated welfare benefits. That leaves a $128.5 billion shortfall.[51][54]
The same calculation for non-Hispanic White Americans produces $2.578 trillion in covered taxes, against $967.9 billion in welfare benefits—a $1.610 trillion surplus. Per resident, the comparison is −$2,565 versus +$8,348, a difference of $10,913 annually, expressed in 2025 dollars.[55] Inspect the comparison.
Within this account, Black Americans collectively receive more than they contribute, while non-Hispanic White Americans collectively contribute substantially more than they receive. Non-Hispanic White taxpayers also account for an estimated 72.4% of federal income-tax revenue in the reconstruction. Of the two groups compared, they provide all of the positive group balance in the measured tax-and-welfare account. They supply a major part of the revenue base financing public assistance, including benefits received by Black Americans.[51][54]
The financing requirement is unavoidable. If every American recorded the same estimated −$2,565 annual balance as Black Americans in this reconstruction, the measured account would have an approximately $850 billion annual shortfall. Maintaining those benefits would require other revenue, borrowing, or changes to spending and contributions. The benefits cannot finance themselves.
Blanket accusations against White Americans also deserve scrutiny. In one analysis of the 2020 ANES, racial favoritism was substantially stronger among Black, Hispanic and Asian respondents than among White respondents. White respondents gave nearly equal average warmth ratings across all four groups. The other three respondent groups each favored their own race and rated White Americans less warmly than every other group measured. The pattern demonstrates stronger expressed in-group bias and a relative bias against Whites in those ratings.[30][31]
The $14 trillion reparations demand should be rejected as fiscally unjustified. The argument presented has not established an inherited debt owed by today’s taxpayers. Existing redistribution is substantial, and White taxpayers’ contributions cannot simply be erased from the account.
Assigning White Americans a collective financial obligation because of their skin color is racially discriminatory. Today’s individuals are responsible for their own conduct. Ancestry alone establishes neither personal guilt nor a debt to another racial group.
Calculations & sources.
The graphics use the same reconstruction as the accompanying dossier. The historical total is a model estimate. Its calculation and annual values are available below.
Chart 04 / How the tax and welfare comparison is calculated +
1. Official Census inputs, tabulated by Pro-West Institute
Our survey-weighted tabulation of official U.S. Census Bureau microdata estimates these FICA and state income-tax totals for 2023. Census is an agency within the U.S. Department of Commerce. Census publishes the underlying modeled tax values; this racial breakdown is our aggregation.[51][53][56]
| Census variable | Census description | Black Americans | Non-Hispanic White Americans |
|---|---|---|---|
FICA | Social security retirement payroll deduction | $98.865bn | $551.409bn |
STATETAX_A | State income tax liability, after all credits | $44.169bn | $312.431bn |
Pro-West Institute | |||
The exact fields appear in the official data dictionary, printed page 6C-31 (PDF page 51). FICA occupies person-record positions 753–757; STATETAX_A occupies 765–770. The person weight MARSUPWT has two implied decimal places.[52]
Black includes Black alone and identifiable multiracial Black people, including Hispanic Black people. White means non-Hispanic White alone. Income-tax liability follows the race of the tax-unit head or dependent filer; FICA follows the person. Population denominators include children and nonrecipients.
2. Federal income-tax shares and Treasury allocation
We apply the same weighting formula to FEDTAX_AC, Census’s federal income-tax liability after refundable credits. The national modeled total is $1,763.966585bn. Each group’s modeled amount is divided by that national total.[51][52][53]
| Calculation | Black Americans | Non-Hispanic White Americans |
|---|---|---|
| Modeled federal income-tax liability | $146.304646bn | $1,277.410100bn |
| Group amount ÷ national amount | 8.2940713% | 72.4169103% |
| Allocated Treasury receipts | $180.518886bn | $1,576.140294bn |
Pro-West Institute | ||
Treasury records $2,176.481bn in individual income-tax receipts for fiscal year 2023. We multiply that published national total by each group’s unrounded Census-model share. This allocation assumes the modeled calendar-year shares apply to fiscal-year receipts.[54]
3. Add state income tax and FICA, then adjust prices
Only the federal component is scaled to Treasury receipts. State income tax after credits and FICA retain their Census-model values.
| Component | Black Americans | Non-Hispanic White Americans |
|---|---|---|
| Allocated federal income-tax receipts | $180.519bn | $1,576.140bn |
| Census state income tax after credits | $44.169bn | $312.431bn |
| Census FICA | $98.865bn | $551.409bn |
| Covered taxes · 2023 dollars | $323.552bn | $2,439.980bn |
| Covered taxes · 2025 dollars | $341.860bn | $2,578.041bn |
Pro-West Institute | ||
The two CPI-U annual averages come from the Bureau of Labor Statistics. Each nominal tax subtotal is multiplied by the same factor.[6]
4. Calculate the welfare allocation
The broad spending model uses Cato’s $1,800bn anchor for 2021, extended to 2023 using CBO’s means-tested spending index. The CBO source workbook is T2_Arrington Means Test Letter, Table 2: L32 = 1,036.364 for 2021; N32 = 1,126.474 for 2023.[4][5]
Our linked CBO/Census tabulation assigns 22.75482787% of 2023 core-benefit dollars to Black Americans. The core categories are Medicaid/CHIP, SNAP, SSI, federal housing assistance and reported cash public assistance. CBO adjusts the first four categories for survey underreporting. The core-dollar share is then applied to the broader spending total.[1][2][55]
The non-Hispanic White welfare allocation is $967.9bn, the rounded 2023 output in the working dossier’s Table 8. The comparison retains that source precision of 0.1bn. Its original unrounded White core-benefit numerator is not stored with this page.[55]
5. Subtract welfare and divide by the full group population
Per-person amount = group amount ÷ full group population
| Calculation | Black Americans | Non-Hispanic White Americans |
|---|---|---|
| Covered taxes − welfare | −$128.5bn | +$1,610.1bn |
| Full group population | 50,114,889.84 | 192,882,355.51 |
| Balance per person | −$2,565 | +$8,348 |
Pro-West Institute | ||
Each displayed value is rounded independently. The same defined tax and welfare categories apply in both columns. See the tax and spending scope, including other taxes and spending outside the calculation and unreconciled refundable-credit overlap.
Cato’s $1.8 trillion estimate: accounting audit
Cato’s $1.8 trillion estimate: flawed accounting, plausible scale
Cato’s widely quoted $1.8 trillion annual welfare estimate was constructed by adding more than $1.1 trillion in federal spending to $744 billion described as additional state and local funding. The problem is that Cato’s linked state/local source reports gross expenditure, including spending financed by federal grants. Adding that whole amount to federal expenditure counts transferred money twice.[57][58]
The distinction is substantial. In the revised 2019 Census records, state/local public welfare expenditure totals $745.3 billion, while federal welfare grants received total $483.6 billion. Subtracting those transfers leaves approximately $261.7 billion to be financed through state and local resources. The gross expenditure cannot be treated as an entirely additional state/local contribution.[59]
That accounting error does not establish that a figure around $1.8 trillion is implausible for 2023. A separate comparison using government records produces the following broad spending account:
| 2023 component | Billions of dollars |
|---|---|
| Federal Health function | $888.590 |
| Federal Income Security function | $774.314 |
| Gross state/local public welfare expenditure | $1,049.732 |
| Deduct federal welfare grants received by state/local governments | −$717.341 |
| Combined broad spending cross-check | $1,995.295 |
Pro-West Institute | |
The federal figures come from Table 9 of Treasury’s final September 2023 Monthly Treasury Statement. The state/local figures come from the Census Bureau’s revised 2023 government-finance public-use records. All amounts are nominal dollars. Federal welfare grants are deducted before the state/local component is added, leaving a net state/local contribution of $332.391 billion.[60][61]
This independent comparison places broad health and income-support spending at approximately $2 trillion in 2023, making $1.8 trillion a plausible working benchmark for spending of that broad scope. Its classification must remain explicit: the Health function includes research and public-health activities, while Income Security includes federal employee retirement benefits and unemployment compensation alongside means-tested assistance. A programme-specific welfare total requires those components to be separated.[62]
How the estimates are calculated +
Annual allocation
2024 example: $1,974.028bn × 23.591986% × 1.026313 = $477.967bn in 2025 dollars. Dividing by 50.760m Black residents gives $9,416 per person.
Spending and racial shares
CRS historical totals cover 1979–2004. Later Cato benchmarks are interpolated; the 2021 $1.8T anchor is extended with a CBO means-tested spending index. Early racial-share benchmarks are interpolated, with a 1.035703 scope adjustment from non-Hispanic Black to the broader Black definition. Annual 2000–2024 core-program shares come from CPS/CBO tabulations. The 2024 share is held in 2025 and 2026.
The narrower core-benefit dollar share is used as a proxy for allocating the broader welfare total. Programme inventories and federal/state-local grant treatment are not independently reconciled across every benchmark. This is a reproducible allocation model, not an audited racial ledger of all welfare expenditure.
Participation and population
Participation covers Medicaid/CHIP, SNAP, SSI, federal housing assistance and reported cash public assistance. CBO imputations are used for the first four. Household SNAP and housing benefits count household members; people are counted once for the combined receipt rate. The full group population, including children, is used for per-person figures.
Historical finance and slaveholding
The war-spending conversion updates CRS’s $59.631bn in constant FY2011 dollars using annual consumer prices: $59.631bn × (967.5 ÷ 676.0) = $85.345bn in 2025 purchasing power. Using the Minneapolis Fed’s estimated 2026 CPI of 1,001.3 gives $88.326bn. These are approximate CPI updates, separate from the welfare series and not added to it. The source-period military cost is $3.183bn; veterans’ benefits and debt interest are excluded.
The ownership upper bound is 393,975 recorded slaveholders ÷ 26,690,781 White residents × 100 = 1.476%, displayed as ≤1.48%. The holder numerator covers all recorded holders, so assigning every holder to the White population produces an upper bound. The resident denominator includes children. The figure does not measure slaveholding households, economic interests or present-day descendants.
Attitudes and international aid
Chart 10 transcribes Zigerell’s published weighted means and 83.4% intervals; it does not re-estimate the ANES microdata or establish an absence of discrimination. Public spending is financed by taxpayers across racial groups and does not identify individual donors’ attitudes. Chart 11 distinguishes the USAID disbursement analysis from the African Energy Chamber’s broader attributed estimate. Neither total is added to the US welfare model.
Generational distance
2026 − 1865 = 161 years. At 25 years per generation, 161 ÷ 25 = 6.44, rounded to the nearest half-generation as 6.5.
2026 projection
$1,800bn × (1,185.907 ÷ 1,036.364) × 23.591986% ÷ (328.446 ÷ 320.618) = $474.350bn in 2025 prices. This extends the dossier’s January 2025 CBO baseline; it is not a new 2026 observation. No 2026 population or per-person estimate is supplied.
All allocation figures are gross, before taxes. The $14T proposal is shown at its stated amount; the welfare reconstruction is in 2025 dollars. Their comparison illustrates scale, not a price-matched legal settlement.
Inspect the 48 annual rows +
| Year | Dollar share | Annual $bn | Cumulative $T |
|---|---|---|---|
| 1979 | 38.12% | 156.61 | 0.157 |
| 1980 | 37.54% | 155.54 | 0.312 |
| 1981 | 36.97% | 155.09 | 0.467 |
| 1982 | 36.39% | 148.42 | 0.616 |
| 1983 | 35.82% | 149.89 | 0.766 |
| 1984 | 35.24% | 149.62 | 0.915 |
| 1985 | 35.07% | 152.69 | 1.068 |
| 1986 | 34.91% | 154.11 | 1.222 |
| 1987 | 34.74% | 156.53 | 1.379 |
| 1988 | 34.58% | 162.50 | 1.541 |
| 1989 | 34.41% | 167.84 | 1.709 |
| 1990 | 33.67% | 178.07 | 1.887 |
| 1991 | 32.92% | 197.96 | 2.085 |
| 1992 | 32.17% | 220.90 | 2.306 |
| 1993 | 31.42% | 221.20 | 2.527 |
| 1994 | 30.67% | 235.07 | 2.762 |
| 1995 | 29.95% | 234.81 | 2.997 |
| 1996 | 29.23% | 225.57 | 3.222 |
| 1997 | 28.52% | 220.39 | 3.443 |
| 1998 | 27.80% | 217.17 | 3.660 |
| 1999 | 27.08% | 214.15 | 3.874 |
| 2000 | 27.04% | 216.62 | 4.091 |
| 2001 | 26.24% | 227.48 | 4.318 |
| 2002 | 26.62% | 243.10 | 4.561 |
| 2003 | 26.38% | 253.48 | 4.815 |
| 2004 | 25.08% | 249.37 | 5.064 |
| 2005 | 25.55% | 255.51 | 5.320 |
| 2006 | 25.07% | 252.23 | 5.572 |
| 2007 | 25.22% | 278.74 | 5.851 |
| 2008 | 25.23% | 299.32 | 6.150 |
| 2009 | 24.88% | 326.67 | 6.477 |
| 2010 | 25.58% | 336.75 | 6.813 |
| 2011 | 24.69% | 321.00 | 7.134 |
| 2012 | 24.88% | 322.71 | 7.457 |
| 2013 | 25.50% | 346.57 | 7.804 |
| 2014 | 24.17% | 342.44 | 8.146 |
| 2015 | 23.18% | 346.29 | 8.492 |
| 2016 | 23.32% | 375.43 | 8.868 |
| 2017 | 23.14% | 395.14 | 9.263 |
| 2018 | 23.26% | 417.45 | 9.680 |
| 2019 | 23.73% | 458.20 | 10.139 |
| 2020 | 22.78% | 472.25 | 10.611 |
| 2021 | 22.40% | 479.10 | 11.090 |
| 2022 | 21.86% | 510.08 | 11.600 |
| 2023 | 22.75% | 470.39 | 12.070 |
| 2024 | 23.59% | 477.97 | 12.548 |
| 2025* | 23.59% | 479.98 | 13.028 |
| 2026* | 23.59% | 474.35 | 13.503 |
Pro-West Institute | |||
*Projected broad spending; 2024 racial share held. Earlier broad spending also includes interpolated and indexed values, as described above.
Browse 62 research sources +
- Census Bureau · CPS Annual Social and Economic Supplement
Microdata behind the 2024 population and participation tabulations; survey year 2025.
- Congressional Budget Office · Transfer imputation code and data
Medicaid/CHIP, SNAP, SSI and housing-assistance imputations. Reported cash public assistance is added from CPS.
- Congressional Research Service · Cash and noncash benefits
Historical federal and state/local means-tested spending series. Its income-tested definition excludes Social Security and Medicare, while including selected means-tested veterans’ medical care and pensions.
- Cato Institute · Poverty and Welfare, 2022 handbook
Later broad spending benchmarks, including the $1.8T 2021 anchor. The source explicitly excludes universal social insurance such as Medicare and Social Security.
- CBO · Mandatory spending data, January 2025 baseline
Table 2, worksheet T2_Arrington Means Test Letter, row 32: L32 (2021) = $1,036.364bn and N32 (2023) = $1,126.474bn. Their ratio extends the model’s $1,800bn anchor to 2023. Table 1 supplies the retained 2025–2026 baseline extension.
- Bureau of Labor Statistics · Annual consumer prices
Conversion of each annual amount into 2025 dollars.
- H.Res.414 · 118th Congress · Introduced 17 May 2023
Cori Bush and cosponsors proposed a minimum $14T financial commitment to close the racial wealth gap. A resolution, not an enacted payment.
- Library of Congress · Civil War soldiers’ stories
Traditional estimate of approximately 360,000 Union deaths.
- National Archives · Black soldiers in the US military
Approximately 179,000 Black Army servicemen, 19,000 in the Navy and nearly 40,000 Black Army deaths.
- National Archives · The 13th Amendment
Ratified 6 December 1865, abolishing slavery and involuntary servitude except as punishment for crime.
- UK Parliament · Parliament and the British slave trade
Britain abolished its slave trade in 1807; abolition of slavery itself came later.
- National Archives · The slave trade
The US import prohibition took effect on 1 January 1808. Illegal imports and the domestic slave trade continued.
- UK National Archives · Slavery
Royal Navy suppression of the Atlantic trade: more than 1,600 ships seized and about 150,000 Africans freed over decades.
- CEPR · Uniform March CPS extracts
Early racial-share benchmarks used in the historical reconstruction.
- CBO · Economic projections, January 2025
2026 CPI growth forecast, rebased to the actual 2025 price index for the final projected row.
- National Park Service · Civil War facts
Union enlistment composition; the Union forces were overwhelmingly White.
- Pew Research Center · Views of reparations for slavery
Survey conducted 4–17 October 2021; analysis published 28 November 2022. Support for repaying descendants of people enslaved in the US: Black adults 77%, all US adults 30%, White adults 18%. The question did not specify the $14T proposal.
- Walk Free · Global Slavery Index 2023 · Arab States
Estimated 1.7 million people in modern slavery on any given day in 2021; 10.1 per 1,000 people, the highest regional prevalence. This estimate covers the report’s Arab States region; North African countries are classified in its Africa region. Modern slavery includes forced labour and forced marriage.
- Smithsonian National Museum of American History · The slave trade
Approximately 388,000 enslaved Africans were brought directly to the United States before the 1808 import ban. This is a historical Atlantic-arrivals figure, not imports during the Civil War or the entire enslaved population in 1860.
- 1860 Census · Slaveholding returns, reproduced by The Valley of the Shadow
The slave-ownership variables report 393,975 slaveholders nationally. A named-holder count is not a count of every person in a slaveholding household or everyone with an economic interest in slavery. Original volume: Census Bureau, Agriculture of the United States in 1860 (1864).
- Congressional Research Service · Costs of Major U.S. Wars (2010)
Union military operations, 1861–1865: $3.183bn in source-period dollars; $59.631bn in constant FY2011 dollars. Excludes veterans’ benefits, interest on war debt and assistance to allies.
- Federal Reserve Bank of Minneapolis · Consumer Price Index, 1800 onward
Annual CPI indices, 1967 base: 2011 = 676.0; 2025 = 967.5; 2026 estimate = 1,001.3. Used to update CRS’s FY2011-dollar benchmark; 2026 remains an estimate.
- National Park Service · Introduction to European Heritage
Approximately 12 million immigrants passed through Ellis Island between 1892 and 1954, many arriving from European countries. This documents substantial immigration after abolition, not a count of present-day descendants without slaveholding ancestors.
- Carter G. Woodson · Free Negro Owners of Slaves in the United States in 1830 (1924)
Primary census-based directory. Introduction discusses both commercial exploitation and the purchase of family members; legal ownership is not a uniform measure of commercial slaveholding.
- Encyclopedia Virginia · Historical accuracy of The Known World
Historical section reproduces Thomas J. Pressly’s analysis of Woodson’s 1830 records: 3,776 free Black slaveholders and 12,907 enslaved people. This is an 1830 benchmark, not an 1860 or 1865 total. Its percentage language is not used here; individual and household denominators must be distinguished.
- College of Charleston · The Trans-Atlantic Slave Trade
University digital-history account of European coastal trading, Portuguese raiding and the development of Atlantic trafficking.
- Library of Congress · African immigration: Beginnings
European merchants purchased captives, many seized by African allies through warfare or raids, and transported them to American colonies.
- Alana Wise · NPR · Cori Bush introduces reparations resolution
17 May 2023 NPR report, reproduced by Georgia Public Broadcasting. Source for the quoted statement. The supplied photo shows Bush at a Just Majority event in St Louis on 8 May 2023. Image credit: Dilip Vishwanat/Getty Images for Just Majority.
- American National Election Studies · 2020 Time Series Study
Official study documentation. The chart here follows Zigerell’s analysis of the March 2021 preliminary release, rather than presenting it as a fresh analysis of the later full release. Group warmth uses a 0–100 feeling thermometer; 50 is neutral.
- L. J. Zigerell · How racial groups rate each other
25 March 2021 analysis underlying the user-supplied graphic. Includes analysis code and plot data; the displayed estimates are weighted. These are self-reported group ratings.
- L. J. Zigerell · Numerical survey output
Pages 14–19: weighted means and 83.4% confidence intervals reproduced in Chart 10. Weight: V200010b. White and Black respondent categories are non-Hispanic; the Asian respondent category includes Native Hawaiian/other Pacific Islander respondents. Sample sizes vary by rated group.
- Africa Data Hub · USAID funding of African countries, 2001–2024
3 December 2025 analysis of ForeignAssistance.gov disbursement data: $131.6bn through USAID to African countries. Covers one agency, not all US foreign assistance. Source-reported dollars; no conversion into the article’s 2025-dollar welfare series.
- African Energy Chamber · NJ Ayuk on aid to Africa
5 February 2025 commentary states that aid to Africa since 1960 exceeded $2.6T. Presented here as the Chamber’s attributed estimate. It supplies no annual reconstruction, price base or exact terminal year; this is not an independently reconciled OECD total or US-only spending.
- Council on Foreign Relations · Trump Dumps African Aid
Ebenezer Obadare, 21 March 2025. Cites the African Energy Chamber for the estimate of more than $2.6T in aid to Africa since 1960.
- OECD · Private Philanthropy for Development, third edition (2026)
Overview, section 1.2 and Figures 1.1–1.2: Africa received $17.6bn in cross-border philanthropic funding during 2020–2023, in constant 2023 US dollars. Covers international donors in the report’s data collection, not US donors alone or every private donation. Separate from USAID disbursements; not added to the broader $2.6T estimate.
- BLS via FRED · Black federal income-tax mean
2023: $5,540 per consumer unit. Race follows the reference person; this is a CE estimate.
- BLS via FRED · Non-Black federal income-tax mean
2023: $11,739 per consumer unit. Includes White, Asian and all other non-Black reference-person races.
- BLS via FRED · Black consumer-unit count
2023: 17,950 thousand consumer units, converted to 17.950 million.
- BLS via FRED · Non-Black consumer-unit count
2023: 116,606 thousand consumer units, converted to 116.606 million.
- BLS · Consumer Expenditure definitions and tax methodology
Consumer units, reference-person race and TAXSIM tax estimates. These means are not per-person or per-worker amounts.
- WHO · Global Health Expenditure Database
12 December 2025 release. 2022 FS.1 domestic government revenues and FS.2 government-channelled foreign health funding. FS.3 social-insurance contributions are excluded.
- WHO · Global Health Expenditure Database methodology
2025 methodology, Annex 1. Revenue classifications FS.1, FS.2 and FS.3.
- World Bank · ASPIRE social-assistance spending
Selected national programme-year snapshots, 2020–2023. Expenditure GDP sheet, column I, excluding health services.
- World Bank · The State of Social Safety Nets 2018
Table D.1, printed pp.138–143. Excludes health fee waivers. South Africa: 3.31% of GDP; Botswana: 1.66%.
- World Bank · Social Safety Nets in Africa, 2018
Realizing the Full Potential of Social Safety Nets in Africa, Tables G.1–G.2, pp.328 and 331. Angola uses the later 0.4% revision.
- World Bank · Built to Include, 2023
Figure 19, p.31. Social assistance for six African MENA countries, including generalized food subsidies and excluding health fee waivers.
- World Bank · World Development Indicators
2022 GDP, NY.GDP.MKTP.CD, and population, SP.POP.TOTL. Population across the 54-country ledger: 1,444,092,389.
- World Bank · South Sudan selected indicators
October 2024, PDF p.2. 2022 GDP of $5,449.4 million fills the missing WDI observation.
- BLS · Consumer expenditures in 2023
Table 17 supplies the same 2023 race-of-reference-person consumer-unit counts.
- CBO · Fiscal year 2023 receipts
Table 2: $2,176bn in actual individual income-tax receipts. Different accounting period and measure from calendar-year modeled liabilities.
- Census Bureau · 2024 CPS ASEC public-use microdata
Our weighted tabulation of 144,265 person records: $146.305bn Black net federal income-tax liability / $1,763.967bn nationally = 8.2941%. Non-Hispanic White alone: $1,277.410bn / $1,763.967bn = 72.4169%. Tax year 2023; survey year 2024.
- Census Bureau · 2024 ASEC data dictionary
Tax Model Items, printed p.6C-31 (PDF p.51): FICA, person-record positions 753–757; STATETAX_A, positions 765–770. MARSUPWT, printed p.6C-2: two implied decimals, divided by 100. PRDTRACE and PEHSPNON define the racial groups.
- Census Bureau · CPS ASEC tax model
Modeled tax liabilities, tax-unit construction and limitations. Joint income-tax liability is attributed to the tax-unit head; refunds reduce net liability. This is not an IRS administrative racial total.
- US Treasury · FY2023 individual income-tax receipts
Table 2, 2023 Actual: $2,176,481 million. This recorded national total is allocated using unrounded Census model shares. The allocation assumes those shares apply across timing and accounting differences; Treasury does not publish these racial allocations.
- Pro-West Institute · Black America dossier · Table 8
Working dossier, version 8, Table 8, 2023 row: non-Hispanic White welfare allocation of $967.9bn in 2025 dollars, rounded to one decimal. This is the broad allocation model, using core-benefit dollar shares.
- U.S. Census Bureau · Who we are
The Census Bureau is an agency within the U.S. Department of Commerce. The tax-model inputs are Census-published; the racial totals displayed here are Pro-West Institute survey-weighted tabulations.
- Cato Institute · Don’t Expand Middle-Class Welfare
Michael D. Tanner, 29 September 2022. Adds more than $1.1T in federal spending to $744bn described as additional state/local funding. The $744bn hyperlink points to Urban Institute’s gross public-welfare expenditure series.
- Urban Institute · State and Local Public Welfare Expenditures
The gross state/local expenditure series includes federal grant financing. Its 2021 example reports $862bn of expenditure, of which $585bn was financed by federal transfers.
- Census Bureau · Revised 2019 state and local government finance data
National state/local aggregate in 19statetypepu.txt: direct public-welfare expenditure $745.344125bn; federal public-welfare grants B79 $483.611233bn; residual $261.732892bn. Published amounts are in thousands of dollars.
- U.S. Treasury · Final September 2023 Monthly Treasury Statement
Table 9, printed page 38: FY2023 Health function outlays $888,590m and Income Security function outlays $774,314m. Medicare and Social Security are separate functions.
- Census Bureau · Revised 2023 state and local government finance data
Revised public-use files, July 2026. National combined aggregate 001 in 23statetypepu.txt: E77 + E79 + F77 + F79 = $1,049.732157bn public-welfare expenditure; B79 federal grants = $717.341203bn; residual = $332.390954bn. Raw amounts are in thousands of dollars. Census consolidated several welfare codes from 2022 onward.
- Congressional Research Service · Federal budget functions and subfunctions
May 2024 report. Health includes services, research/training and consumer/occupational health and safety. Income Security includes retirement/disability, federal employee pensions and unemployment compensation, alongside housing, food and other income support.